In the previous post, we introduced Streamlit and covered some basic features.
In this post, we’ll explore more advanced features, including navigation, tabs, columns and containers that allow us to create more complex and organized web apps.
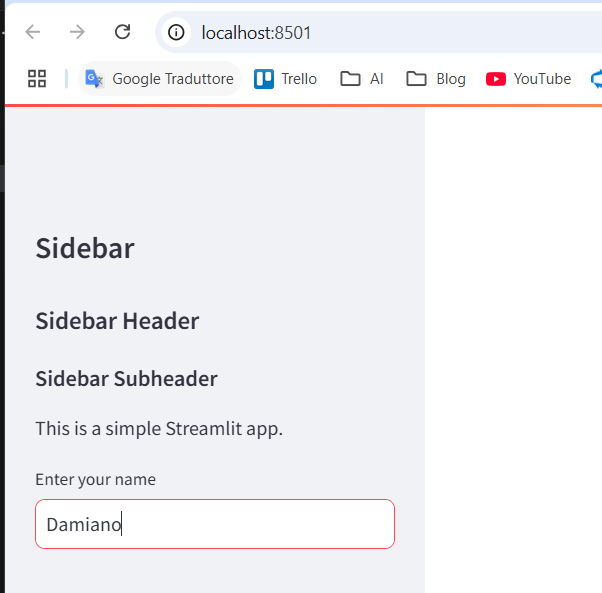
SIDEBAR
A sidebar can be added to our applications to house widgets, menus, or inputs that organize the user interface.
import streamlit as st

# sidebar
st.sidebar.title('Sidebar')
st.sidebar.header('Sidebar Header')
st.sidebar.subheader('Sidebar Subheader')
st.sidebar.write('This is a simple Streamlit app.')
name = st.sidebar.text_input('Enter your name')

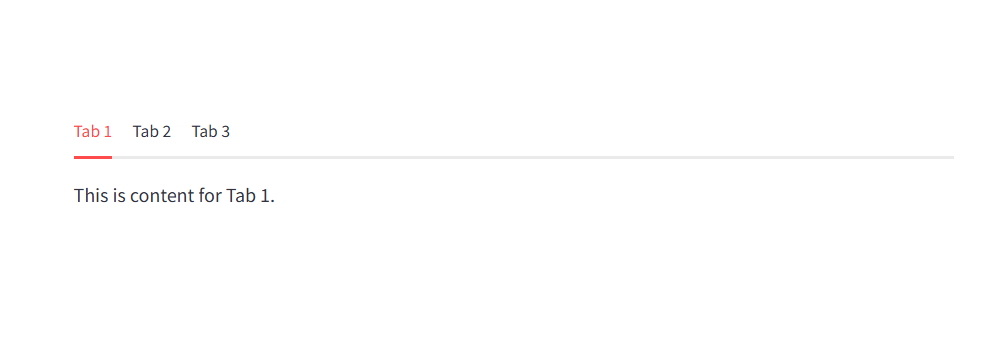
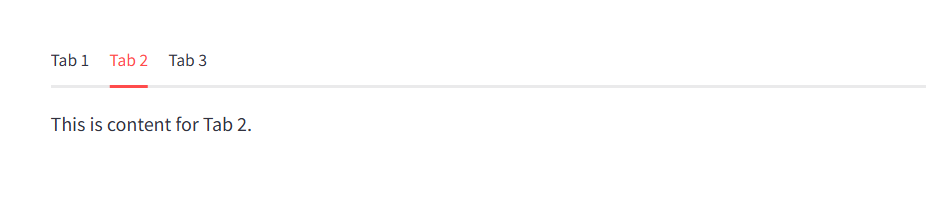
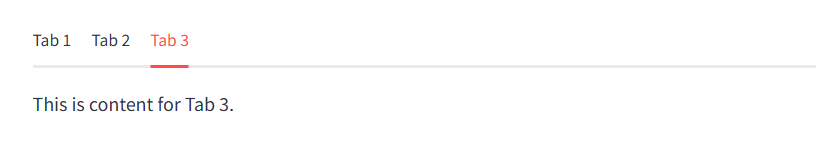
TABS
Tabs allow us to separate content into multiple sections that users can easily navigate between.
import streamlit as st

# Create tabs
tab1, tab2, tab3 = st.tabs(["Tab 1", "Tab 2", "Tab 3"])

with tab1:
    st.write("This is content for Tab 1.")

with tab2:
    st.write("This is content for Tab 2.")

with tab3:
    st.write("This is content for Tab 3.")
COLUMNS
Columns are useful for organizing content horizontally.
import streamlit as st

# Create columns
col1, col2 = st.columns(2)

with col1:
    st.write("Content for Column 1.")

with col2:
    st.write("Content for Column 2.")

EXPANDERS
Expanders allow us to hide details until they are needed.
with st.expander("See more details"):
        st.write("This is additional content inside an expander.")


CONTAINER
Containers are useful for grouping content.
import streamlit as st

with st.container(border=True):
    st.header('Container')
    st.write('This is a container')

with st.container(border=True):
    st.header('Container 2')
    st.write('This is the second container')

NAVIGATION
Streamlit allows us to create multi-page apps using the st.navigation function. Here’s an example of how to set up navigation between two pages.
import streamlit as st

pg = st.navigation([st.Page("page1.py"), st.Page("page2.py")])
pg.run()
In this example, page1.py and page2.py are separate Python files that represent different pages of our app.
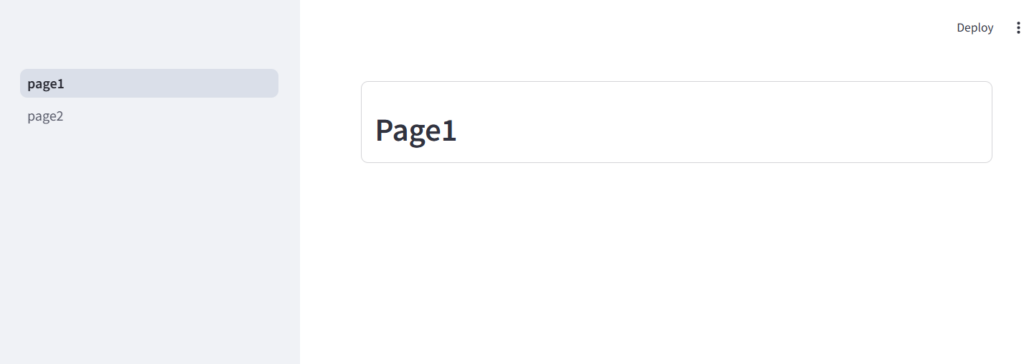
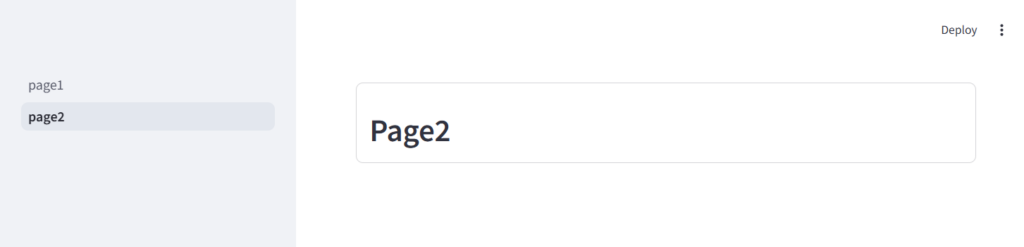
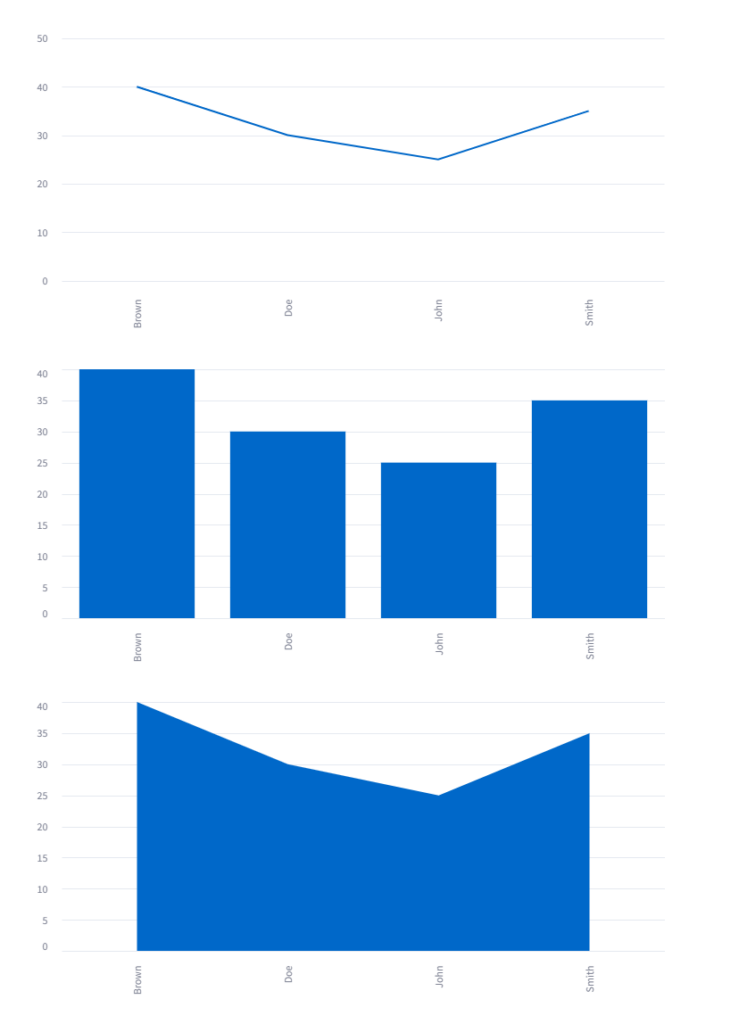
CHART AND PLOTS
import pandas as pd
import streamlit as st


# Create a DataFrame with user names and their respective ages
data = pd.DataFrame({
    'User': ['John', 'Doe', 'Smith', 'Brown'],  # Names of the users
    'Age': [25, 30, 35, 40]  # Corresponding ages of the users
})

# Display a line chart to visualize the Age of each User
st.line_chart(data.set_index('User'))  # Setting 'User' as the index to plot against 'Age'

# Display a bar chart to show the Age of each User in a bar format
st.bar_chart(data.set_index('User'))  # Similar to the line chart but visualized as bars

# Display an area chart to visualize the Age data with filled areas below the line
st.area_chart(data.set_index('User'))  # Uses the same indexed data with a filled style
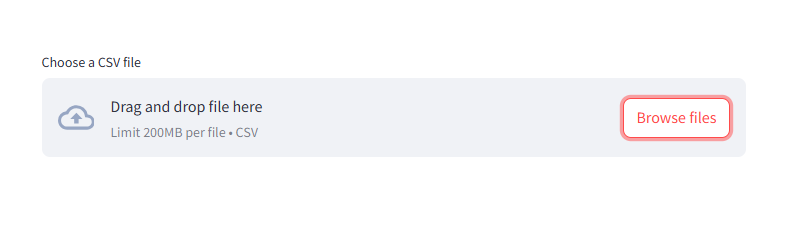
FILE UPLOADERS
import streamlit as st
import pandas as pd

uploaded_file = st.file_uploader("Choose a CSV file", type="csv")
if uploaded_file is not None:
    data = pd.read_csv(uploaded_file)
    st.dataframe(data)